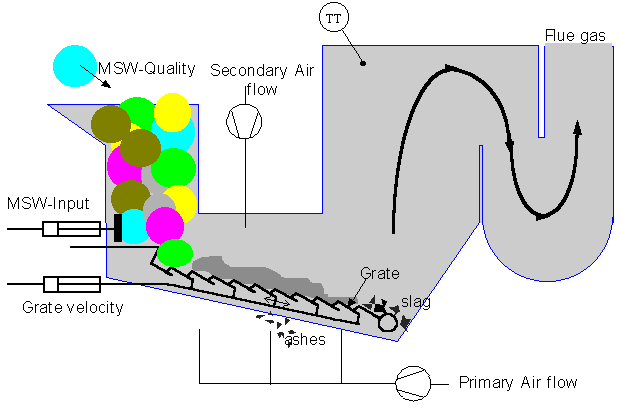
Fig. .21 Furnace for incinerating MSW.
Plant description : the furnace.
The main component of a furnace used to burn MSW is the grate. In the plant of Girona, this is a Martin grate with two inclined conveyors with backward movement. An hydraulic ram is used to activate the grate to produce a to-and-from movement to make the refuse to advance while it is burning. Ashes are separated by gravity. Fig. 6.21 shows the situation of the main components in the furnace. The MSW passes through three different areas in the grate. The first one is the drier, where the refuse is heat at high temperature to decrease its humidity. Later on, in the combustion area, the refuse is burned and transformed in ashes and slag. Finally, the fire extinguishes in the third area and the slag is ejected. Although the refuse is dried in the first area, when it goes trough the second area, the calorific value and the humidity of this material is not constant, and it is difficult to control the furnace to assure an uniform flue gas.

These variables are strongly interrelated. It is difficult to establish
a dynamic model of the furnace, because some of these variables are difficult
to measure or present a non-uniform distribution in the oven. Despite that
the exact dependencies are not quite known, the influence of some variables
on the evolution of the furnace is clear and, in fact, control is basically
performed actuating on three variables:
Actions on these variables are decided according to the temperature
evolution, MSW-quality and steam flow in the normal operation mode. O2
contents are taken into account in start and stop modes. The first variable,
combustion air flow, is automatically regulated according to the set point
established. And the second and third variables are manually tuned according
to the temperature variations (in the furnace and steam flow) and MSW-Quality.
About MSW quality.
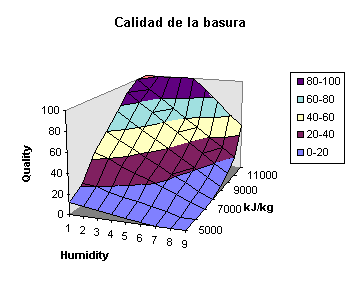
The main problem in controlling the furnace described before, is the kind of row material used as input and the inherent difficulty to measure it. As a consequence, the temperature measured of the flue gas, used in the steam production, suffers sudden variations as shown in the register of Fig. 6.23. The output temperature is not very useful in controlling the furnace because of the thermal inertia of the furnace. Therefore, it seems better to undertake some action to anticipate process dynamics.

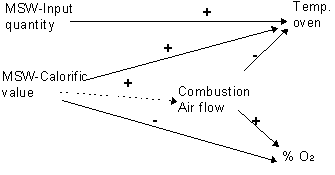
Thus, the challenge is to take benefit of the operator experience and process engineer knowledge and to try to predict the evolution of the furnace. Expert engineer established the influences depicted in Fig. 6.24 between process variables and MSW, when a positive variation is given one of the MSW parameters depicted in the figure:
With the goal of using expert observances, process operators were asked to fill a table to roughly classify the quality of MSW input, according to their expert criteria, and the changes performed in the furnace parameters (grate velocity and variation of MSW quantity). This information has been used to estimate the temperature variations in the furnace without taking into account the regulation of the combustion air flow. ALCMEN has been used with this goal to establish a graph and to simulate these dependencies. It has been tested with the data of a fortnight during the summer. The lexical domain for the all the variables involved is defined with two positive labels for positive increasing (indices 1 and 2) and two negative, for decreasing situations (indices -1 and -2) from the normal mode (index = 0). The MSW-Input quantity and grate velocity are obtained directly as qualitative variables according to the position of commands selected by the operator. On the other hand, the indices corresponding to MSW quality are estimated to be centred between 25% and 30% because the period of year during which the measures have been acquired, i.e. summer, is characterised by wet garbage (due to the big amount of fruits and vegetables). Then, the indices used are :
MSW-Input quantity : ![]()
Grate velocity : ![]()
And the ALCMEN relationship in the CASSD framework, modelling the positive influence of these variables in the evolution of temperature, are depicted in Fig. 6.25.
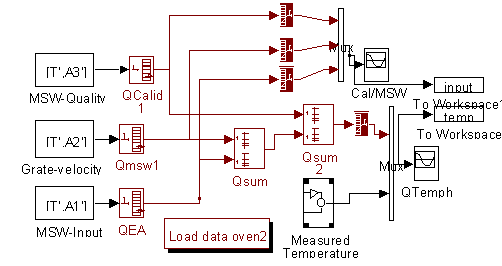
Two simple blocks (Qsum and Qsum2) have been used to add the MSW influence (Quality, Grate-velocity and quantity of MSW Input). The behaviour of this qualitative estimator is tested using qualitative data supplied by the operators as input and the register of temperature in the oven. The temperature evolution has been smoothed and qualified in 5 zones around the average value. The comparison of both can be observed in Fig. 6.26.
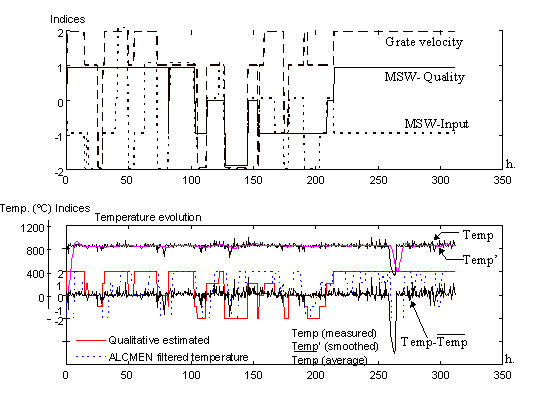
The validity of these results is up to 215 hours because after that all input remains constant (it was because an emergency occurred and operator left the last value). When the time equal 260h. the temperature is decreasing very fast due to a stop in the plant and which is not reflected in the input set of values. Then, the final set of data must be rejected. The evolution of qualitative estimated temperature and the qualification of real data have similar behaviour. There does not exist a perfect matching between both, but large oscillations are more or less detected. A delay between both can be observed, because the temperature transmitter is placed very far from the input of MSW, and the data given, refers to the input MSW. Moreover, MSW quality is given outside of the input hopper. Although the general evolution is satisfactory, it must be contrasted with more data and added with the influence of the air flow although it remains constant when selected a working point.